
Customizing Charts in OutSystems: Adding that extra spice with JavaScript
Published at 25-2-2025
OutSystems Charts makes it easy to visualize data, but what if you need more control—like advanced tooltips, dynamic updates, or custom interactions? Since it’s built on HighCharts, you can unlock a wide range of features using JavaScript. Let’s take your graphs from a “nice..” to a “whoa!”.
In this guide, I’ll show you how to do just that.
Why bother?
OutSystems Charts covers the basics, but HighCharts itself has a ton of cool features built-in. Just take a peek at HighCharts demos — there’s much more available than what Outsystems provides currently Today, we’ll look at two ways to extend your charts:
- UpdateProviderConfigs - The OutSystems-approved way
- HighCharts Update API - The “brute-force” approach
What are we building?
To make life easy, I’ve provided a quick start module you can download here . It includes a basic chart and example data. You’ll find a Graph1 & Graph2 screen with an AreaChartInitialized action—this is where we’ll add our custom magic.
We’ll be using this same config for both methods:
const config = {
title: {
useHTML: true,
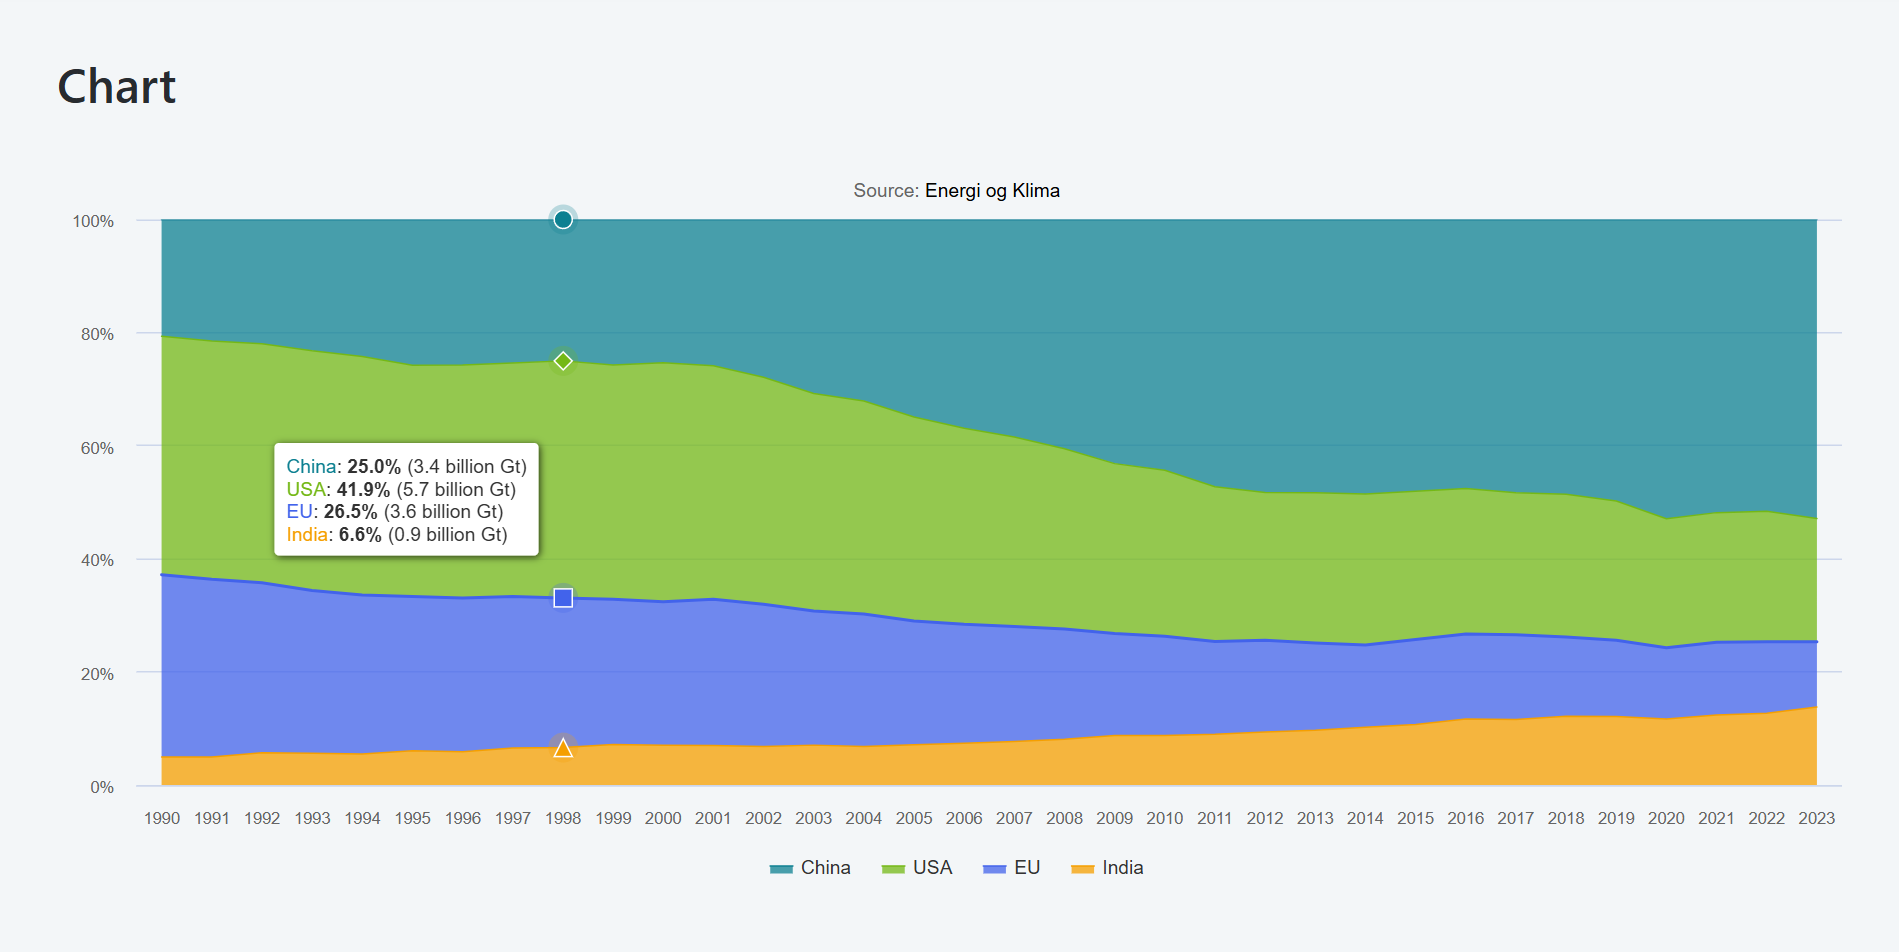
text: "Countries/regions with highest Gt CO<sub>2</sub>-emissions",
},
subtitle: {
text: 'Source: <a href="https://energiogklima.no/klimavakten/land-med-hoyest-utslipp/" target="_blank">Energi og Klima</a>',
},
tooltip: {
format:
"{#each points}<span style='color:{series.color}'>{series.name}</span>: <b>{point.percentage:.1f}%</b> ({point.y:,.1f} billion Gt)</br>{/each}",
shared: true,
},
plotOptions: {
area: {
stacking: "percent",
marker: { enabled: false },
},
},
};I’ve already provided it on the sample, so that you don’t have to fiddle with that.
Method 1: UpdateProviderConfigs
OutSystems provides a JavaScript API for updating chart configurations while keeping things in sync with its internal model.
Pros:
✅ Changes persist across re-renders
Cons:
❌ Some properties mysteriously don’t work (trial & error required)
❌ Config has to be passed as a serialized JSON string
❌ Does not allow passing functions
One major limitation of this method is that it does not allow passing functions (like custom tooltip formatters or event handlers) due to security restrictions.
Example:
OutSystems.ChartAPI.Chart.GetById($parameters.WidgetId).setProviderConfigs(
  JSON.stringify(config),
);
You may paste this line into the JavaScript node SetConfig in the sample.
Method 2: HighCharts Update API
This method uses HighCharts’ own .update() function. Unlike the first method, it allows you to pass a normal JavaScript object—which is easier in some cases.
Pros:
✅ More flexible
✅ Supports full HighCharts functionality
Cons:
❌ OutSystems will overwrite your config on re-render (so you need to reapply it)
Example:
OutSystems.ChartAPI.Chart.GetById($parameters.WidgetId).provider.update(config);You may paste this line into the JavaScript node SetConfig of the second graph screen in the sample.
The result
Boom! Both methods will give you this beautifully customized chart:
Final thoughts
Congrats! You now have the power to tweak and enhance your charts like a pro. Use it wisely.
Before diving straight into JavaScript, always check if you could use OutSystems own helper actions, like SetHighchartsChartConfigs. That could save you some finicking with Javascript. Again, your mileage might differ.
Good luck and Happy charting!